基本的なこと
MetaTrader4で表示する価格データのグラフに対して、グラフやマークなど追加表示する機能をインジケータと呼んでいます。テクニカル分析で使われる移動平均線やボリンジャーバンドなどはこのインジケータで実現しています。
インジケータはMQL4という言語でできています。価格データが変化するたびにイベントが発生するので、そのたびに計算して結果を出力する形になります。
double型配列をバッファとして宣言、描画スタイル諸々を設定しておくことで、MetaTrader4側で面倒なグラフエリアへの描画を行ってくれます。
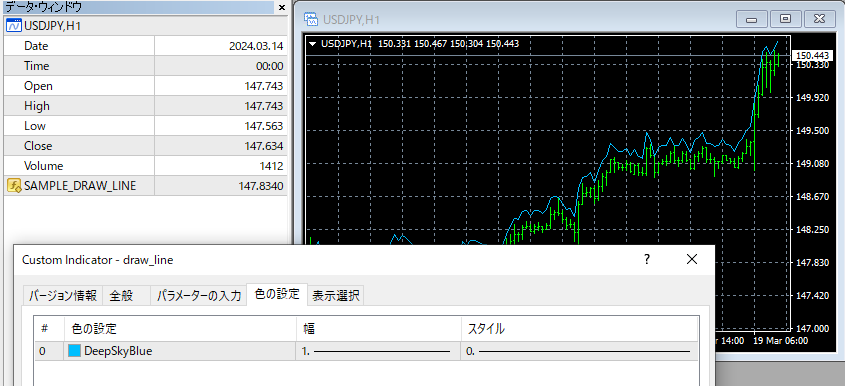
DRAW_LINE
折れ線グラフを描画するサンプルです。価格レート+X の位置にグラフを描画します。
//+------------------------------------------------------------------+
//|                                                  line_sample.mq4 |
//|                              Copyright 2024, komina77@outlook.jp |
//|                                          https://www.komina.info |
//+------------------------------------------------------------------+
#property copyright "Copyright 2024, komina"
#property link      "https://www.komina.info"
#property version   "1.00"
#property strict
#property indicator_chart_window
#property indicator_buffers 1

#property indicator_label1  "SAMPLE_DRAW_LINE"
#property indicator_type1   DRAW_LINE
#property indicator_color1  clrDeepSkyBlue
#property indicator_style1  STYLE_SOLID
#property indicator_width1  1

input double InpDifference=0.2;   // Difference

double Buffer_1[];

//+------------------------------------------------------------------+
//| Custom indicator initialization function                         |
//+------------------------------------------------------------------+
int OnInit()
{
   IndicatorShortName("draw_line");

   SetIndexBuffer(0, Buffer_1);

   return(INIT_SUCCEEDED);
}
//+------------------------------------------------------------------+
//| Custom indicator iteration function                              |
//+------------------------------------------------------------------+
int OnCalculate(const int rates_total,
                const int prev_calculated,
                const datetime &time[],
                const double &open[],
                const double &high[],
                const double &low[],
                const double &close[],
                const long &tick_volume[],
                const long &volume[],
                const int &spread[])
{
   int limit = rates_total - prev_calculated -1;
   if (limit < 0)  limit = 0;

   for (int i = limit; i >= 0; i--) {
      if (IsStopped())  break;
      Buffer_1[i] = close[i] + InpDifference;
   }
   return(rates_total);
}
//+------------------------------------------------------------------+
解説
#property indicator_chart_window
#property indicator_buffers 1indicator_chart_windowは価格チャートと同じウィンドウにグラフを描画することを意味します。
indicator_buffersはこのプログラムで描画するグラフに要するバッファの数を設定します。最大7です。
#property indicator_label1  "SAMPLE_DRAW_LINE"
#property indicator_type1   DRAW_LINE
#property indicator_color1  clrDeepSkyBlue
#property indicator_style1  STYLE_SOLID
#property indicator_width1 11つ目のグラフについて、ラベル名、描画タイプ、色、線種、線幅といった情報を宣言しています。これらは後から関数を使って変更・設定することもできますが、#propertyにより宣言することでユーザが好みで変更することができるようになります。
double Buffer_1[];

//+------------------------------------------------------------------+
//| Custom indicator initialization function                         |
//+------------------------------------------------------------------+
int OnInit()
{
   IndicatorShortName("draw_line(" + DoubleToString(InpDifference) + ")");

   SetIndexBuffer(0, Buffer_1);

   return(INIT_SUCCEEDED);
}
グローバルな変数としてバッファを宣言。それを SetIndexBuffer関数により 0番目のラインと紐づけています。IndicatorShortName関数で設定しているのは、表示中のインジケータにマウスオーバーしたときに表示される名前です。パラメータが一目でわかるようにしておくと使い勝手が良いです。
int OnCalculate(const int rates_total,
                const int prev_calculated,
                const datetime &time[],
                const double &open[],
                const double &high[],
                const double &low[],
                const double &close[],
                const long &tick_volume[],
                const long &volume[],
                const int &spread[])
{
   int limit = rates_total - prev_calculated -1;
   if (limit < 0)  limit = 0;

   for (int i = limit; i >= 0; i--) {
      if (IsStopped())  break;
      Buffer_1[i] = close[i] + InpDifference;
   }
   return(rates_total);
}OnCalculateはグラフ描画が必要なるたびに呼び出される関数です。rates_totalはグラフに必要な点の数。通常はそのまま戻り値で返しておけば良いです。prev_calculatedは計算済のグラフの点の数。描画に必要な部分だけ計算できる仕組みになっています。
time[], open[], high[], low[], close[], tick_volume[], volume[], spread[] といった配列は、直近が[0]、インクリメントするごとに過去データになっていくように配置されています。
グラフに紐づけられたバッファも同様です。計算結果をバッファに設定することでグラフとして描画されます。
直近の[0]は今まさに価格が変動中の足です。価格が変わるたびに何度も呼ばれることになるので、全ての足が計算済( rates_total == prev_calculated )のように見えても再計算が必要です。
変数limitにはもっとも古い要計算データの添え字が入ります。そこから直近の[0]まで Forループで回しています。ループ中で IsStoped() をチェックしているのは、チャートを閉じるときに速やかに終わるようにするためです。
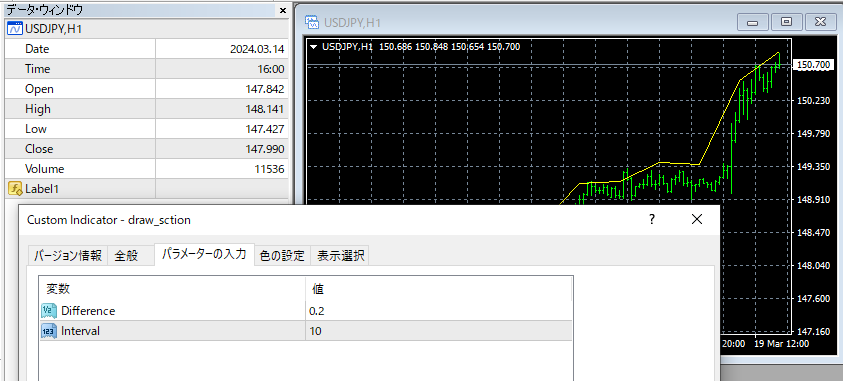
DRAW_SECTION
DRAW_LINEと似てますが、空(Empty)の値を設定して、そのポイントをスキップした折れ線グラフを描画することができます。
//+------------------------------------------------------------------+
//|                                                  draw_sction.mq4 |
//|                                         Copyright 2024, komina77 |
//|                                          https://www.komina.info |
//+------------------------------------------------------------------+
#property copyright "Copyright 2024, komina77"
#property link      "https://www.komina.info"
#property version   "1.00"
#property strict
#property indicator_chart_window
#property indicator_buffers 1

#property indicator_label1  "SAMPLE_DRAW_SECTION"
#property indicator_type1   DRAW_SECTION
#property indicator_color1  clrYellow
#property indicator_style1  STYLE_SOLID
#property indicator_width1  1

input double InpDifference=0.2;  // Difference
input int InpInterval=10;        // Interval

double Buffer_1[];

int cnt=0;
datetime dt = TimeCurrent();
//+------------------------------------------------------------------+
//| Custom indicator initialization function                         |
//+------------------------------------------------------------------+
int OnInit()
{
   IndicatorShortName("draw_section(" + DoubleToString(InpDifference) + ")");
   SetIndexBuffer(0, Buffer_1);
   SetIndexEmptyValue(0, 0.0);
   return(INIT_SUCCEEDED);
}
//+------------------------------------------------------------------+
//| Custom indicator iteration function                              |
//+------------------------------------------------------------------+
int OnCalculate(const int rates_total,
                const int prev_calculated,
                const datetime &time[],
                const double &open[],
                const double &high[],
                const double &low[],
                const double &close[],
                const long &tick_volume[],
                const long &volume[],
                const int &spread[])
{
   int limit = rates_total - prev_calculated -1;
   if (limit < 0)  limit = 0;

   for (int i = limit; i >= 0; i--) {
      if (IsStopped())  break;
      if (TimeToString(time[i]) != TimeToString(dt)) {
         cnt ++;
         dt = time[i];
      }
      if ((cnt % InpInterval) == 0) {
         Buffer_1[i] = close[i] + InpDifference;
      } else {
         Buffer_1[i] = 0.0;
      }
   }

   return(rates_total);
}
//+------------------------------------------------------------------+
解説
#property indicator_type1 DRAW_SECTIONDRAW_LINEの代わりにDRAW_SECTIONを指定します。
//--- indicator buffers
double Label1Buffer[];
//+------------------------------------------------------------------+
//| Custom indicator initialization function                         |
//+------------------------------------------------------------------+
int OnInit()
{
   IndicatorShortName("draw_section(" + DoubleToString(InpDifference) + ")");
   SetIndexBuffer(0, Buffer_1);
   SetIndexEmptyValue(0, 0.0);
   return(INIT_SUCCEEDED);
}
DRAW_SECTION固有の設定として、SetIndexEmptyValue関数を用いて空(Empty)の値に相当する値を指定します。ここでは 0.0 を指定しています。
つまり Buffer_1[n]= 0.0 としたところ以外を結んだ折れ線グラフになります。
int OnCalculate(const int rates_total,
                const int prev_calculated,
                const datetime &time[],
                const double &open[],
                const double &high[],
                const double &low[],
                const double &close[],
                const long &tick_volume[],
                const long &volume[],
                const int &spread[])
{
   int limit = rates_total - prev_calculated -1;
   if (limit < 0)  limit = 0;

   for (int i = limit; i >= 0; i--) {
      if (IsStopped())  break;
      if (TimeToString(time[i]) != TimeToString(dt)) {
         cnt ++;
         dt = time[i];
      }
      if ((cnt % InpInterval) == 0) {
         Buffer_1[i] = close[i] + InpDifference;
      } else {
         Buffer_1[i] = 0.0;
      }
   }

   return(rates_total);
}空値でスキップするため変数cntを利用してInpDifferenceおきにプロットしています。変数dtを使って足が変わったのを認識し、変数cntをインクリメントしています。
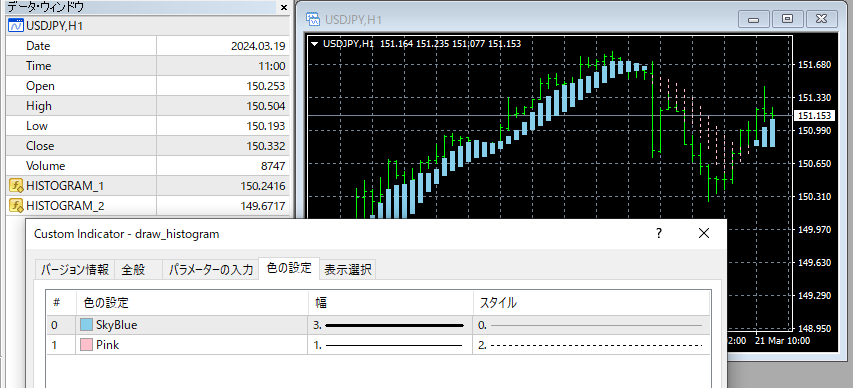
DRAW_HISTOGRAM
DRAW_HISTOGRAMではDRAW_LINEやDRAW_SECTIONとは異なり、バッファを2つ必要とします。その2つの値を間に足ごとの棒グラフを描画します。また、どちらの値が大きいかによって、色・線幅・スタイルを設定できます。
サブウィンドウへ描画する場合はバッファは1つ、0とのバッファ値の間で棒グラフを描画します。
//+------------------------------------------------------------------+
//|                                               draw_histogram.mq4 |
//|                                         Copyright 2024, komina77 |
//|                                          https://www.komina.info |
//+------------------------------------------------------------------+
#property copyright "Copyright 2024, komina77"
#property link      "https://www.komina.info"
#property version   "1.00"
#property strict
#property indicator_chart_window
#property indicator_buffers 2

#property indicator_label1  "HISTOGRAM_1"
#property indicator_type1   DRAW_HISTOGRAM
#property indicator_color1  clrSkyBlue
#property indicator_style1  STYLE_SOLID
#property indicator_width1  3

#property indicator_label2  "HISTOGRAM_2"
#property indicator_type2   DRAW_HISTOGRAM
#property indicator_color2  clrPink
#property indicator_style2  STYLE_DOT
#property indicator_width2  1

input double InpDifference=0.2;   // Difference

double Buffer_1[];
double Buffer_2[];
//+------------------------------------------------------------------+
//| Custom indicator initialization function                         |
//+------------------------------------------------------------------+
int OnInit()
{
   IndicatorShortName("draw_histogram");
   SetIndexBuffer(0, Buffer_1);
   SetIndexBuffer(1, Buffer_2);
   return(INIT_SUCCEEDED);
}
//+------------------------------------------------------------------+
//| Custom indicator iteration function                              |
//+------------------------------------------------------------------+
int OnCalculate(const int rates_total,
                const int prev_calculated,
                const datetime &time[],
                const double &open[],
                const double &high[],
                const double &low[],
                const double &close[],
                const long &tick_volume[],
                const long &volume[],
                const int &spread[])
{
   int limit = rates_total - prev_calculated -1;
   if (limit < 0)  limit = 0;

   for (int i = limit; i >= 0; i--) {
      if (IsStopped())  break;
      Buffer_1[i] = iMA(Symbol(), Period(), 5, 0, MODE_SMA, PRICE_CLOSE, i);
      Buffer_2[i] = iMA(Symbol(), Period(), 12, 0, MODE_SMA, PRICE_CLOSE, i);
   }
   return(rates_total);
}
//+------------------------------------------------------------------+
解説
#property indicator_buffers 2

#property indicator_label1  "HISTOGRAM_1"
#property indicator_type1   DRAW_HISTOGRAM
#property indicator_color1  clrSkyBlue
#property indicator_style1  STYLE_SOLID
#property indicator_width1  3

#property indicator_label2  "HISTOGRAM_2"
#property indicator_type2   DRAW_HISTOGRAM
#property indicator_color2  clrPink
#property indicator_style2  STYLE_DOT
#property indicator_width2  1
インジケータのバッファを2つ分、色・線幅・スタイルも上下2パターン分、設定します。
インジケータのバッファは、0-1、2-3、4-5、6-7 のいずれかの組合せにします。
double Buffer_1[];
double Buffer_2[];
//+------------------------------------------------------------------+
//| Custom indicator initialization function                         |
//+------------------------------------------------------------------+
int OnInit()
{
   IndicatorShortName("draw_histogram");
   SetIndexBuffer(0, Buffer_1);
   SetIndexBuffer(1, Buffer_2);
   return(INIT_SUCCEEDED);
}DRAW_HISTOGRAMでは棒グラフをラインで囲む機能はないので、見た目が気になる場合は DRAW_LINEを駆使して輪郭線を引くことになります。
DRAW_ARROW
インジケータに売買サインなどを表示するケースで活躍するのが DRAW_ARROW です。バッファに価格を入れると、その場所に Wingdingsフォントのキャラクターが表示されます。表示しない場所には EMPTY_VALUE を設定します。
//+------------------------------------------------------------------+
//|                                                   draw_arrow.mq4 |
//|                                         Copyright 2024, komina77 |
//|                                          https://www.komina.info |
//+------------------------------------------------------------------+
#property copyright "Copyright 2024, komina77"
#property link      "https://www.komina.info"
#property version   "1.00"
#property strict
#property indicator_chart_window
#property indicator_buffers 1


#property indicator_label1  "SAMPLE_ARROW"
#property indicator_type1   DRAW_ARROW
#property indicator_color1  clrWhite
#property indicator_width1  5

input int InpInterval=10;        // Interval
input int InpCharactor=SYMBOL_THUMBSUP;   // Symbol

double Buffer_1[];

int cnt=0;
datetime dt = TimeCurrent();
//+------------------------------------------------------------------+
//| Custom indicator initialization function                         |
//+------------------------------------------------------------------+
int OnInit()
{
   IndicatorShortName("draw_arrow(" + IntegerToString(InpInterval) + ")");
   SetIndexBuffer(0, Buffer_1);
   SetIndexArrow(0, InpCharactor);
   return(INIT_SUCCEEDED);
}
//+------------------------------------------------------------------+
//| Custom indicator iteration function                              |
//+------------------------------------------------------------------+
int OnCalculate(const int rates_total,
                const int prev_calculated,
                const datetime &time[],
                const double &open[],
                const double &high[],
                const double &low[],
                const double &close[],
                const long &tick_volume[],
                const long &volume[],
                const int &spread[])
{
   int limit = rates_total - prev_calculated -1;
   if (limit < 0)  limit = 0;

   for (int i = limit; i >= 0; i--) {
      if (IsStopped())  break;
      if (TimeToString(time[i]) != TimeToString(dt)) {
         cnt ++;
         dt = time[i];
      }
      if ((cnt % InpInterval) == 0) {
         Buffer_1[i] = high[i];
      } else {
         Buffer_1[i] = EMPTY_VALUE;
      }
   }
   return(rates_total);
}
//+------------------------------------------------------------------+
解説
#property indicator_width1 5indicator_width# に設定した値によりシンボルのサイズが変わります。
double Buffer_1[];
//+------------------------------------------------------------------+
//| Custom indicator initialization function                         |
//+------------------------------------------------------------------+
int OnInit()
{
   IndicatorShortName("draw_arrow(" + IntegerToString(InpInterval) + ")");
   SetIndexBuffer(0, Buffer_1);
   SetIndexArrow(0, InpCharactor);
   return(INIT_SUCCEEDED);
}
//+------------------------------------------------------------------+SetIndexArrow関数にてインジケータに対応するキャラクターコードを指定します。
https://www.mql5.com/ja/docs/constants/objectconstants/wingdings
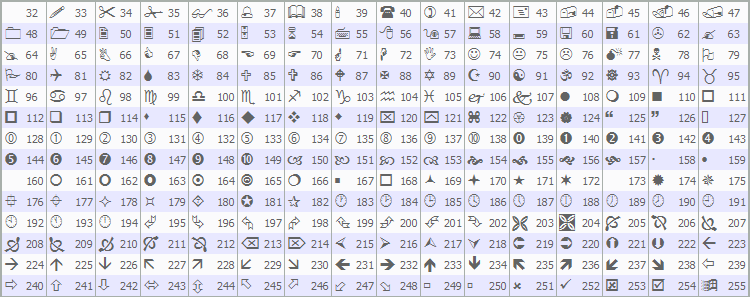
これらのキャラクターコードは SYMBOL_~で始まる定数で定義されているので、コーディングする際は活用するといいと思います。
      if ((cnt % InpInterval) == 0) {
         Buffer_1[i] = high[i];
      } else {
         Buffer_1[i] = EMPTY_VALUE;
      }
シンボルを表示したいポイントの時刻のバッファに価格を設定します。表示ないとき、表示を消すときは EMPTY_VALUE を設定します。
DRAW_ZIGZAG
DRAW_ZIGZAGでは DRAW_HISTOGRAM と同じように2つのバッファを必要とします。DRAW_SECTION のように EMPTY_VALUE をスキップしながらバッファ1と2の間を行き来する折れ線グラフを描きます。バッファ1とバッファ2の間が垂直なラインで結ばれるのが特徴です。矩形波のようなグラフを描けます。
ちなみに、ZigZagインジケータを連想するDRAW_ZIGZAGですが、MT4に同梱されている ZigZag.mq4 では使用されていません。
//+------------------------------------------------------------------+
//|                                                  draw_zigzag.mq4 |
//|                                         Copyright 2024, komina77 |
//|                                          https://www.komina.info |
//+------------------------------------------------------------------+
#property copyright "Copyright 2024, komina77"
#property link      "https://www.komina.info"
#property version   "1.00"
#property strict
#property indicator_chart_window
#property indicator_buffers 2

#property indicator_label1  "SAMPLE_ZIGZAG1"
#property indicator_type1   DRAW_ZIGZAG
#property indicator_color1  clrYellow
#property indicator_style1  STYLE_SOLID
#property indicator_width1  2

#property indicator_label2  "SAMPLE_ZIGZAG2"
#property indicator_type2   DRAW_ZIGZAG

input int InpInterval=10;   // Interval

double Buffer_1[];
double Buffer_2[];

int cnt=0, cnt2=0;
datetime dt = TimeCurrent();
double price=0.0;
//+------------------------------------------------------------------+
//| Custom indicator initialization function                         |
//+------------------------------------------------------------------+
int OnInit()
{
   IndicatorShortName("draw_zigzag(" + DoubleToString(InpInterval) + ")");
   SetIndexBuffer(0, Buffer_1);
   SetIndexBuffer(1, Buffer_2);
   SetIndexEmptyValue(0, 0.0);
   return(INIT_SUCCEEDED);
}
//+------------------------------------------------------------------+
//| Custom indicator iteration function                              |
//+------------------------------------------------------------------+
int OnCalculate(const int rates_total,
                const int prev_calculated,
                const datetime &time[],
                const double &open[],
                const double &high[],
                const double &low[],
                const double &close[],
                const long &tick_volume[],
                const long &volume[],
                const int &spread[])
{
   int limit = rates_total - prev_calculated -1;
   if (limit < 0)  limit = 0;

   for (int i = limit; i >= 0; i--) {
      if (IsStopped())  break;
      if (TimeToString(time[i]) != TimeToString(dt)) {
         cnt ++;
         dt = time[i];
      }
      if ((cnt % InpInterval) == 0) {
         cnt2 ++;
         switch(cnt2 % 6)
         {
            case 0:
               Buffer_1[i] = 0.0;
               Buffer_2[i] = (price == 0) ? low[i] : price;
               break;
            case 1:
               Buffer_1[i] = Buffer_2[i] = high[i];
               price = high[i];
               break;
            case 2:
               Buffer_1[i] = Buffer_2[i] = price;
               break;
            case 3:
               Buffer_1[i] = Buffer_2[i] = low[i];
               price = low[i];
               break;
            case 4:
               Buffer_1[i] = price;
               Buffer_2[i] = high[i];
               price = high[i];
               break;
            case 5:
               Buffer_1[i] = price;
               Buffer_2[i] = low[i];
               price = low[i];
               break;
         }
      } else {
         Buffer_1[i] = 0.0;
         Buffer_2[i] = 0.0;
      }
   }
   return(rates_total);
}
//+------------------------------------------------------------------+
解説
#property indicator_label1  "SAMPLE_ZIGZAG1"
#property indicator_type1   DRAW_ZIGZAG
#property indicator_color1  clrYellow
#property indicator_style1  STYLE_SOLID
#property indicator_width1  2

#property indicator_label2  "SAMPLE_ZIGZAG2"
#property indicator_type2   DRAW_ZIGZAG
バッファ2つ分の設定を行います。色・スタイル・幅はバッファ1の分だけでよいです。
double Buffer_1[];
double Buffer_2[];
//+------------------------------------------------------------------+
//| Custom indicator initialization function                         |
//+------------------------------------------------------------------+
int OnInit()
{
   IndicatorShortName("draw_zigzag(" + DoubleToString(InpInterval) + ")");
   SetIndexBuffer(0, Buffer_1);
   SetIndexBuffer(1, Buffer_2);
   SetIndexEmptyValue(0, 0.0);
   return(INIT_SUCCEEDED);
}
//+------------------------------------------------------------------+
バッファ1と2の割り当て、および DRAW_SECTIONでも出てきた、空(Empty)の値の設定を行います。
バッファ1から2へ向かって垂直のライン、バッファ2から次のバッファ1へ向かってラインが描かれます。バッファ1と2の値を同じにすれば一つの点のように振舞うので DRAW_SECTION のようなラインを引くこともできます。
DRAW_NONE
DRAW_NONEではグラフの描画はされないものの、データウィンドウやステータスバーにて値を参照することができます。用途はちょっと思いつかないです。